Code
import numpy as np
x = np.random.normal(size=100)
import matplotlib.pyplot as plt
plt.hist(x)
plt.show()
np.mean(x)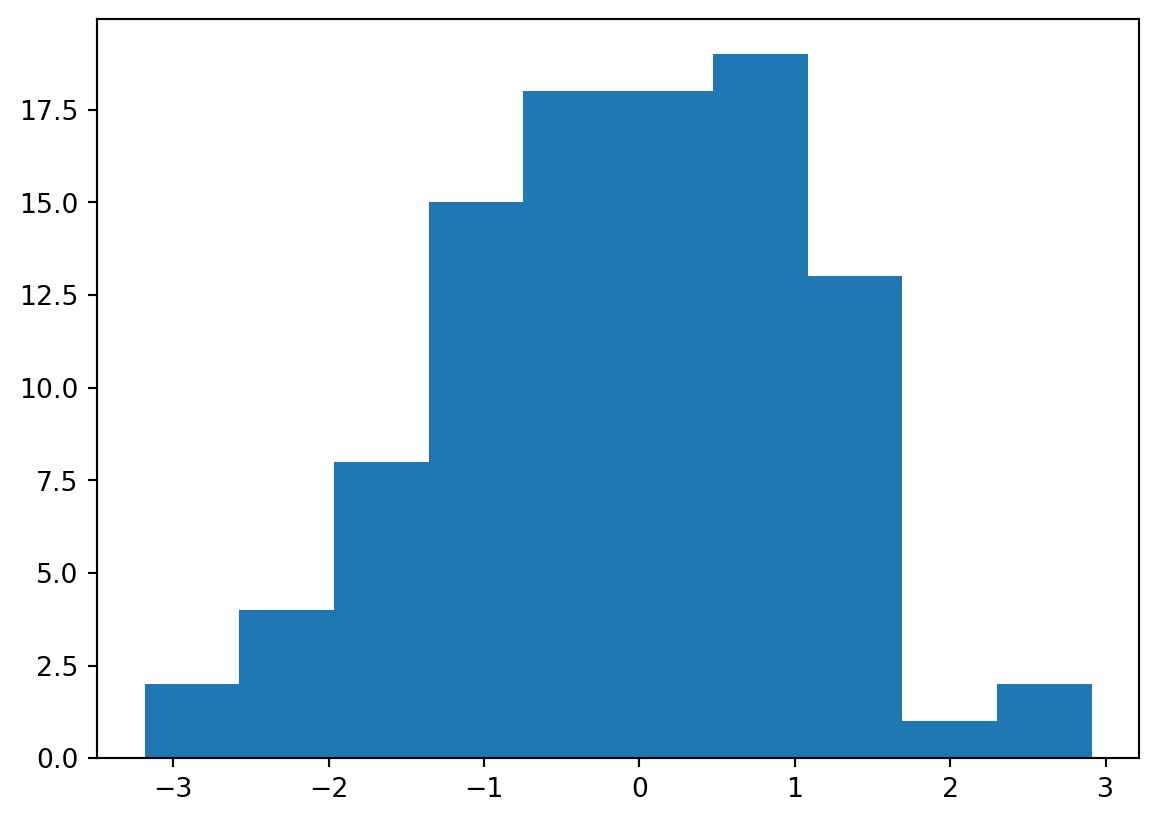
0.080622751461345[UNDER CONSTRUCTION]
This is an example of using qmd as the source document.
import numpy as np
x = np.random.normal(size=100)
import matplotlib.pyplot as plt
plt.hist(x)
plt.show()
np.mean(x)
0.080622751461345\[ \theta = \int_0^\infty f(x,\theta)d\theta \]
This content can be styled via the border class.
This is an example of a callout with a title.
This code is not executed.
fizz_buzz <- function(fbnums = 1:50) {
  output <- dplyr::case_when(
    fbnums %% 15 == 0 ~ "FizzBuzz",
    fbnums %% 3 == 0 ~ "Fizz",
    fbnums %% 5 == 0 ~ "Buzz",
    TRUE ~ as.character(fbnums)
  )
  print(output)
}

fizz_buzz(3)
This code is executed.
def fizz_buzz(num):
  if num % 15 == 0:
    print("FizzBuzz")
  elif num % 5 == 0:
    print("Buzz")
  elif num % 3 == 0:
    print("Fizz")
  else:
    print(num)

fizz_buzz(3)Fizz| Default | Left | Right | Center |
|---|---|---|---|
| 12 | 12 | 12 | 12 |
| 123 | 123 | 123 | 123 |
| 1 | 1 | 1 | 1 |